

Homepage for DFO's State of the Salmon Program.
Canada’s Wild Salmon Policy Strategy 1
Standardized Monitoring of Wild Salmon Status
DFO’s Wild Salmon Policy recognizes the importance of monitoring and conserving salmon biodiversity. Greater biodiversity reduces the risk of species extinctions by increasing the likelihood that some populations will be able to withstand changing circumstances. Salmon biodiversity can also buffer overall abundances from periods of environmental change, since some salmon traits are better adapted to different conditions than others. This is called the portfolio effect; greater diversity, in theory, means that more stable overall abundances are available to support harvest and ecosystem function (Schindler et al. 2010).
The WSP identifies six strategies that are designed to maintain diversity and abundances of Pacific Salmon to the fullest extent possible. The intention is to prevent losses from management and use. But the WSP also acknowledges that there likely will be circumstances when losses of wild salmon populations are unavoidable. Some catastrophic events are beyond human control and DFO may not be able to restore habitat or spawning populations damaged by such events. Further, the rate of climate change in an area may exceed the ability of some salmon populations to adjust.
DFO’s WSP Strategy 1 outlines a broad approach to tracking salmon biodiversity through ‘Standardized Monitoring of Wild Salmon Status’. Within Strategy 1, the WSP prescribes three actions steps:
Action Step 1.1: Identify Conservation Units (CUs)
Action Step 1.2: Develop Criteria to Assess CUs and Identify Benchmarks to Represent Biological Status
Action Step 1.3: Monitor and Assess CU Status
Action Step 1.1: Identify Conservation Units (CUs)
Although adaptive diversity of Pacific salmon occurs at a range of scales that include the species, Conservation Unit (CU), population and deme, the WSP identifies diversity at the scale of CUs as fundamental units that cannot be recolonized if lost. A CU is defined as a group of wild salmon sufficiently isolated from other groups that, if lost, are very unlikely to recolonize naturally within an acceptable timeframe (e.g. a human lifetime or a specified number of salmon generations) (DFO 2005). Pacific salmon CUs are delineated by their salmon ecology, life-history, and genetics (Holtby & Ciruna 2007). For a general summary of how CUs are delineated see Appendix A.2 of Pestal et al. 2024.
There are 381 ‘current’ CUs defined across the five species of salmon managed by DFO in the Pacific Region (Wade et al. 2019). ‘Current’ is a specific CU designation. ‘Current’ CUs are extant (i.e. not extirpated), and are either part of the original CU list developed by Holtby and Ciruna (2007), or have been modified through revisions recommended by local CU experts and approved by a CU expert team. The CU expert team ensures the methodological processes used to modify a current CU delineation align with details presented in Holtby and Ciruna (2007). When the requirment for a CU revision is identified by local CU experts, rationale is provided to Bruce.Baxter@dfo-mpo.gc.ca in the DFO Pacific Science Data Management Unit. Revisions to the original CU list have been completed for Fraser sockeye and Southern BC Chinook (Grant et al. 2011, Brown et al. 2019). An excel list of on-going CU revision requests can be found on a DFO Open Data Site for Conservation Units. One other classification of CU is ‘validation required’ and these are not ‘current’ CUs, but are placeholders pending new genetic, ecological and biological information.
Action Step 1.2: Develop Criteria to Assess CUs and Identify Benchmarks to Represent Biological Status
DFO’s WSP provides a general description of wild salmon status assessments in Strategy 1, Action Step 1.2. The WSP identifies three status zones ranging from Red (poor status), to Amber (intermediate status), and Green (good status), and provides examples of general criteria (metrics) that could be used to assess status at the CU level.
A status assessment toolkit was next developed to provide a set of quantifiable biological status metrics that fall within four classes of status indicators: abundance, trends in abundance, fishing mortality, and distribution (Holt 2009, Holt 2010, Holt et al. 2009). Though the fishing mortality class of indicator has not been used in status assessments, and the distribution metric has been applied qualitatively only. For each quantitative metric, lower (delinates Red to Amber status zones) and upper (delinates Amber to Green status zones) benchmarks were identified. This provides the toolkit, but not the overall structured process required to complete WSP status assessments, which were developed through subsequent processes (see Action Step 1.3: Monitor and Assess CU Status)
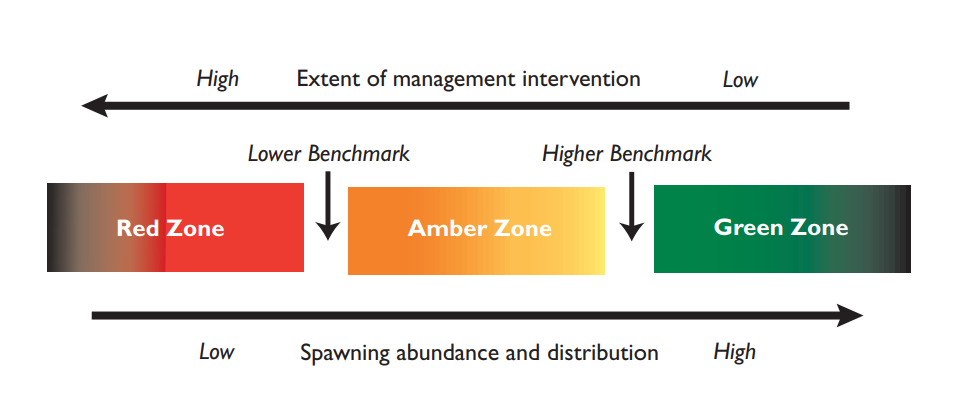 Figure 3 in the Wild Salmon Policy (pg. 17) illustrates how benchmarks delineate biological status for each CU
Action Step 1.3: Monitor and Assess CU status
In Action Step 1.3, annual monitoring programs are required to assess salmon abundance and distribution across populations and CUs in B.C. and the Yukon. For WSP status assessments, population data are grouped into CUs, and appropriate data are selected and processed based on CU expert input. To assess the WSP status of a CU, first metrics are selected from the toolkit depending on the availability of data and other information for the CU, and statuses for each applicable metric are calculated.
The application of the metric toolkit alone does not result in completed WSP status assessments since statuses can differ between the metrics calculated for an individual CU. For example, the percent change metric (percent change over the most recent three generations) can indicate a Red status while the long-term trend metric (comparing the average escapement of the most recent generation to the long-term average) might indicate a Green status.
The final step, after metrics are calculated, is an integration process that combines statuses across metrics, along with standardized data packages on abundance and status time series, into a single WSP status for each CU.