

Homepage for DFO's State of the Salmon Program.
WSP Toolkit: Indicators, Metrics, and Benchmarks
The WSP status toolkit is used within the structured processes of WSP integrated status assessments or WSP rapid status assessments. The WSP Toolkit are criteria that that are selected from by CU experts to support these structured WSP status processes. This is the foundation to ensure status assessments are science-determined (peer-reviewed, objective, repeatable), consistently applied between CUs and years, and enable comprehensive coverage of all 377 ‘current’ CUs with applicable data in B.C. and the Yukon.
WSP metrics fall within four classes of indicators for assessing status: abundance, trends in abundance, fishing mortality, and distribution. Abundance and trends in abundance metrics have been most commonly applied in the WSP status assessments to date. Fishing mortality metrics have not been used because this indicator reflects a threat to a CU rather than an intrinsic property of the CU, and is typically used only when abundance data are not available (Holt et al 2009). Information on distribution was presented in the WSP status assessments for Interior Fraser Coho and Southern BC Chinook. However, benchmarks have not yet been developed to assess distribution metrics, and the information provided in these past processes was not consistently used by experts in determining WSP statuses (DFO 2015, 2016).
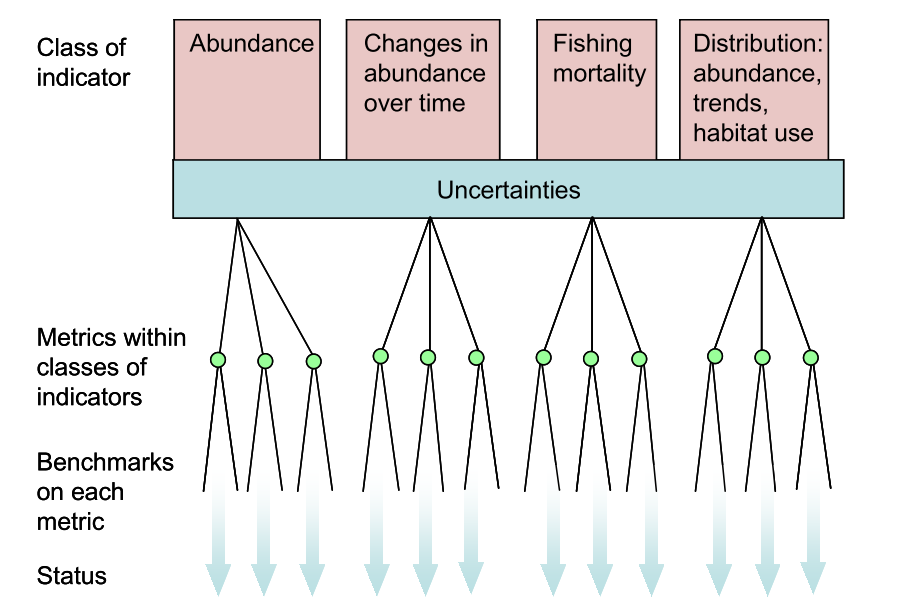
Figure 4 in Holt et al. (2009), pg. 9 illustrates the hierarchy of indicators, quantifiable metrics within each indicator class, and benchmarks on each metric. These were developed by Holt (2009) and Holt et al. (2009) to support the assessment of biological statuses of Conservation Units.
For each metric, lower and upper benchmarks delineate, respectively, the Red to Amber and the Amber to Green WSP biological status zones.
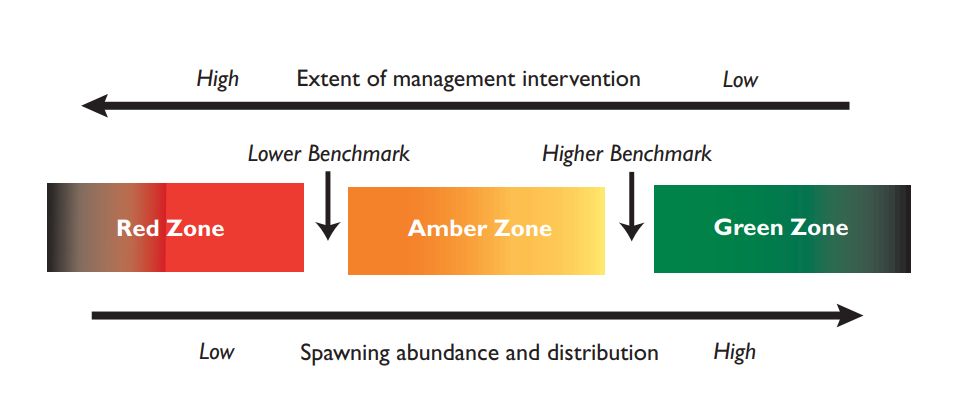
Figure 3 in the Wild Salmon Policy (pg. 17) illustrates how benchmarks delineate biological status zones
The WSP status approach currently relies on two abundance metrics and two trend in abundance metrics that were applied in all four previous assessments (Grant & Pestal 2013, DFO 2015, DFO 2016, Grant et al. 2020). These criteria reflect two paradigms to assess conservation risk emphasized in conservation biology: small population size and declining population (Caughley 1994; Mace et al. 2008).
Abundance Metrics
Relative abundance
The relative abundance metric compares the average spawner abundance in the most recent generation (geometric mean) to CU-specific benchmarks that are estimated using one of the following three methods.
-
Stock-recruitment models (Holt et al. 2009, Grant et al. 2011, Grant and Pestal 2012) Stock-recruitment-based benchmarks are recommended where there is applicable data. Using this method, the lower benchmark is set at Sgen - the escapement that would result in recovery to Smsy in one generation, and the upper benchmark is at 80% Smsy - the spawner abundance at maximum sustainable yield (Holt 2009, 2010; Holt et al. 2009).
-
Freshwater habitat capacity models (Parken et al. 2006; Grant et al. 2011; Grant and Pestal 2012; DFO 2015, 2016; Grant et al. 2020) Freshwater habitat capacity-derived benchmarks have been used for several Southern BC Chinook CUs and one Fraser Sockeye CU. For a number of Southern BC Chinook CUs, habitat-capacity benchmarks were based on the watershed area occupied by the CU (Parken et al. 2006) using Sgen (lower benchmark) and 85% SMSY (upper benchmark), to align with Pacific Salmon Treaty benchmarks. For lake-rearing sockeye, the lake photosynthetic rate (PR) and juvenile sockeye competitors (Grant et al. 2011) could be used to estimate Smax - the spawners at maximum juvenile production for the rearing lake. The recommended lower and upper benchmarks are respectively, 20% and 40% of Smax (Holt 2009, Grant et al. 2011).
-
Percentiles of the spawner abundance time series (Holt et al. 2018) Percentile benchmarks have been recommended for data limited CUs in cases where CU productivity is moderate to high (>2.5 recruits-per-spawner) and harvest rates are moderate to low (≤ 40%) (Holt et al. 2018). They have not yet been used in WSP integrated status assessment processes.
Absolute abundance
The absolute abundance metric compares the average spawner abundance of the most recent generation (geometric mean) to COSEWIC criteria used to define ‘Threatened Species’(COSEWIC 2020).
The lower benchmark is set at 1,000, to align with COSEWIC criterion D1 and the upper benchmark is set at 10,000, which is used in combination with other abundance metrics under criterion C (COSEWIC 2020).
The absolute abundance metric benchmarks are grounded in fundamental principles of population and conservation ecology. The value 1,000 is a critical threshold identified in conservation biology (National Research Council (US) Committee on Scientific Issues in the Endangered Species Act 1998, McElhany et al. 2000). Below 1,000, a population is more at risk from demographic stochasticity, such as randomly in a given year producing mostly males or females. They also are at greater risk from environmental change and catastrophic events, accumulating deleterious genetic mutations, and have a low evolutionary potential to adapt to environmental change.
The value 10,000 is an upper limit on population size conservation risk from environmental variation and catastrophic events; sizes above 10,000 individuals protect populations from moderate to high environmental variation as one example (National Research Council (US) Committee on Scientific Issues in the Endangered Species Act 1998, McElhany et al. 2000).
Wildlife species assessed by COSEWIC and the IUCN may be perpetually classified in Threatened or Endangered categories due to small population sizes. Conservation science shows that higher extinction risk exists for such small populations regardless of whether they have remained stable at low abundances for several generations.
Trends in Abundance Metrics
Long-term trend
The long-term trend metric compares the current generational average (geometric mean) spawner abundance to the long-term average (geometric mean). Lower and upper benchmarks on this metric are set at 50% and 75% respectively.
Percent change
The percent change (short-term trend in abundance) metric estimates the linear change in total spawner abundance over the most recent three generations. Lower and upper benchmarks are set at -15% change and -25% change, respectively.
Ancillary Information used in past WSP integrated status assessment processes
Additional information has been presented in WSP integrated status assessments to support assessment processes. Such information includes: time series plots of spawners, recruitment, productivity, marine and/or freshwater survival, spawning abundances of individual populations within a CU, exploitation rates, and hatchery information wherever relevant and available. Additional context on the metrics has also been presented, including retrospective metric calculations, uncertainty in the metrics, and uncertainty in the relative abundance benchmark estimates (Sgen and Smsy).
While there is a considerable amount of other ancillary information such as information on salmon disease, parasite prevalence, genetic diversity, etc. that could be included to assess salmon status, we do not recommend using these sources of information for the WSP status approach. Instead we recommend continuing to emphasize standardized metrics and additional information that focuses on abundance and trends in abundance.
Where this type of ancillary information is particularly important, however, is in helping understand threats to salmon CUs, and supporting rebuilding considerations.